Backlog Comparison Report
Objective: Gain an understanding of the Backlog Comparison report
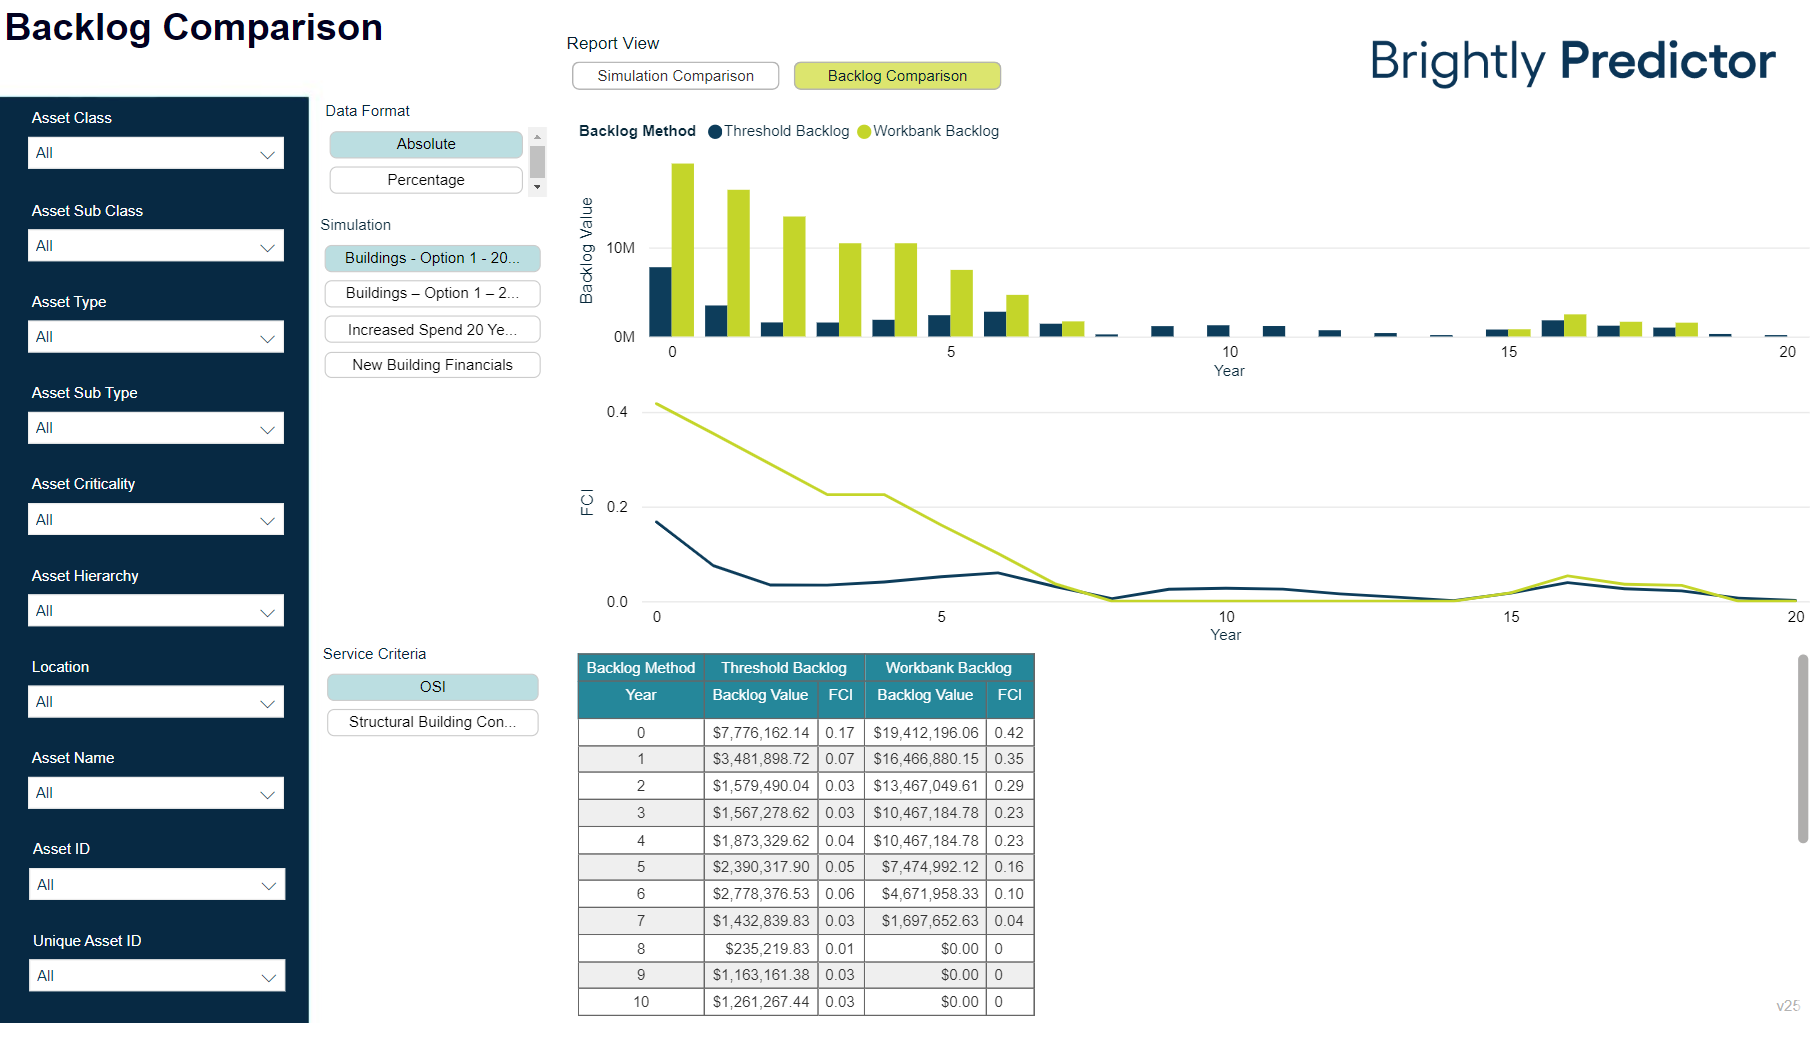
The Backlog Comparison report directly compares the year by year threshold and workbank backlog for each selected Simulation.
Once the Workspace is loaded, users can click on the 'Advanced Comparison' tab to view the Advanced Reports.
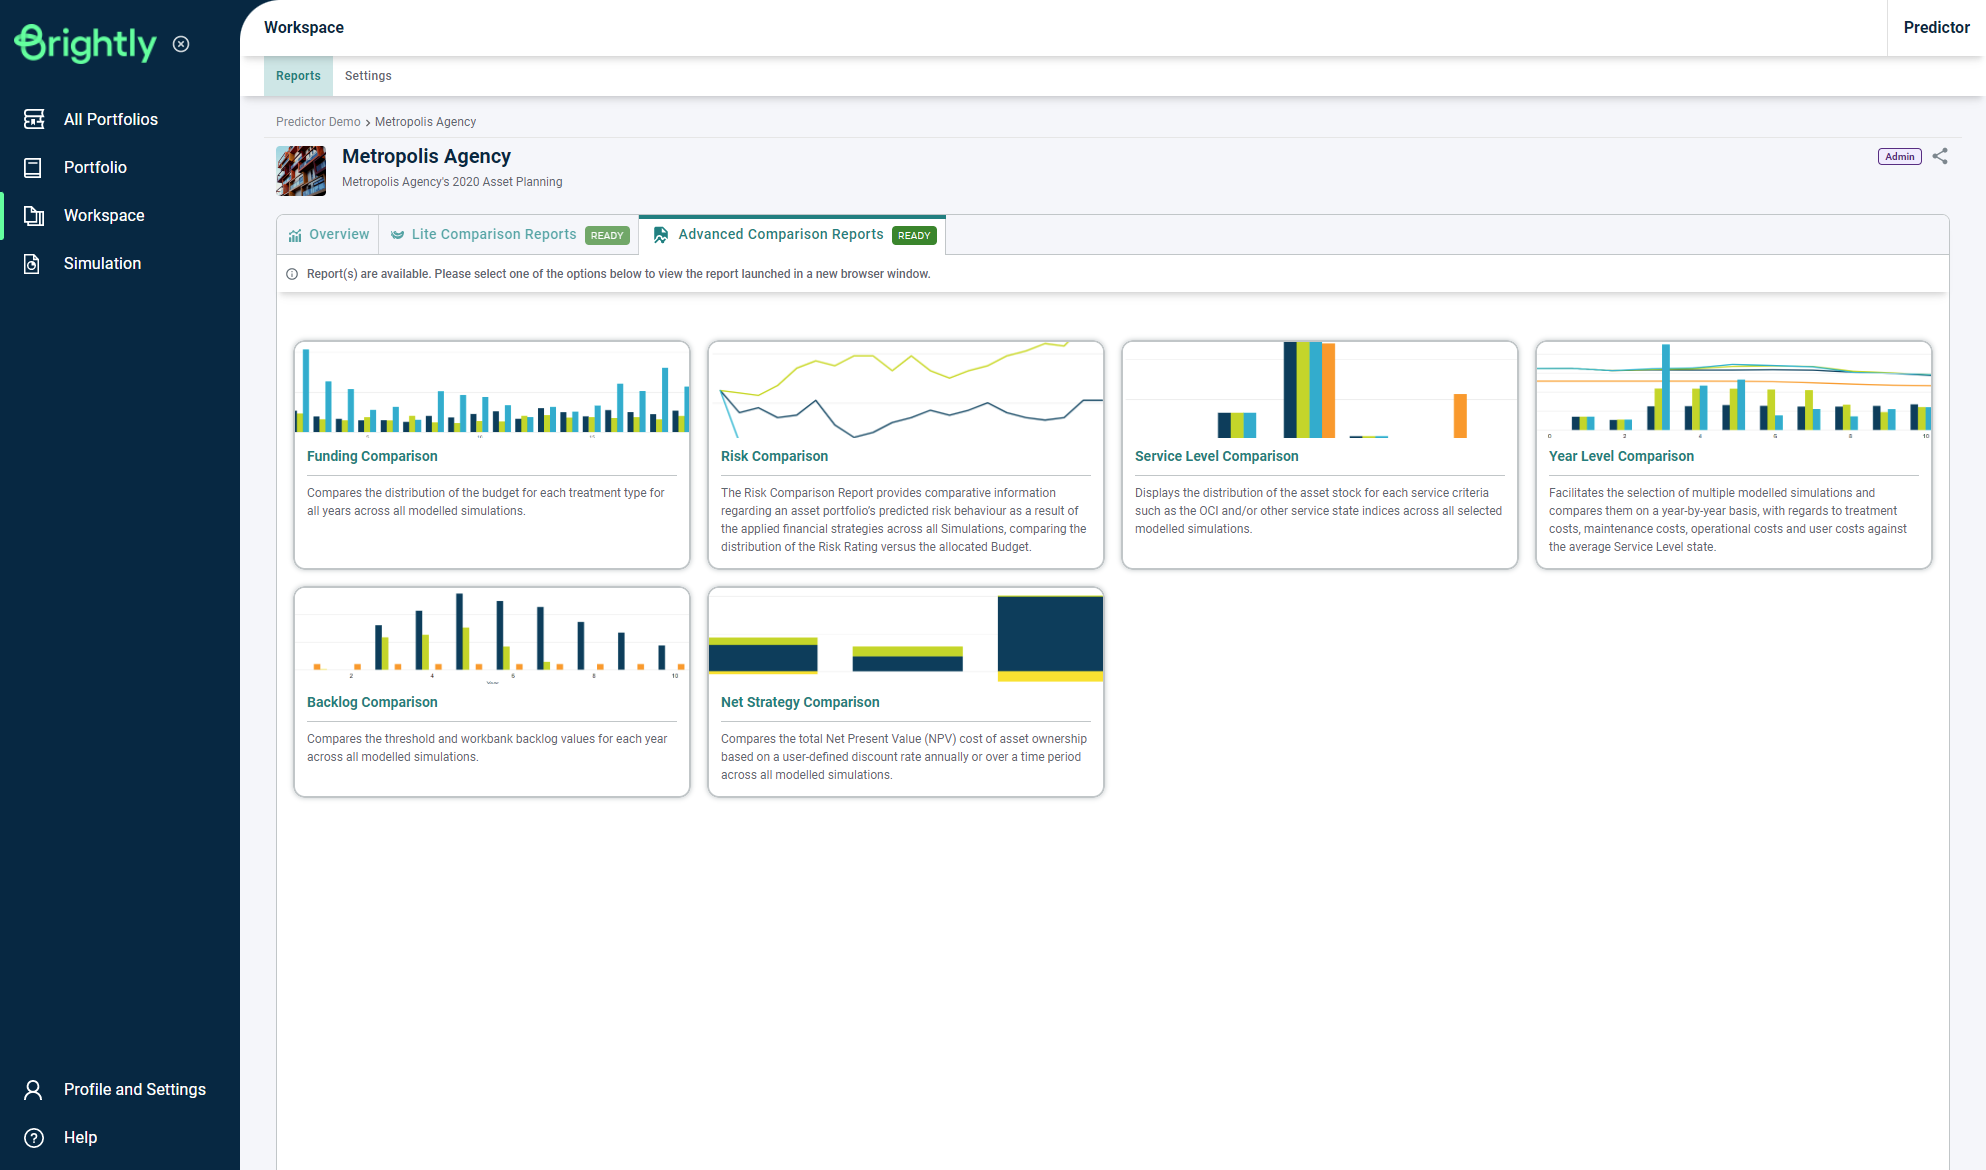
Users can then load the Backlog Comparison report page by clicking on the 'Backlog Comparison' button. Once loaded, on the left, users can select different Comparison or Backlog methods, change the Data Format, and select the Simulations to include in the comparison.
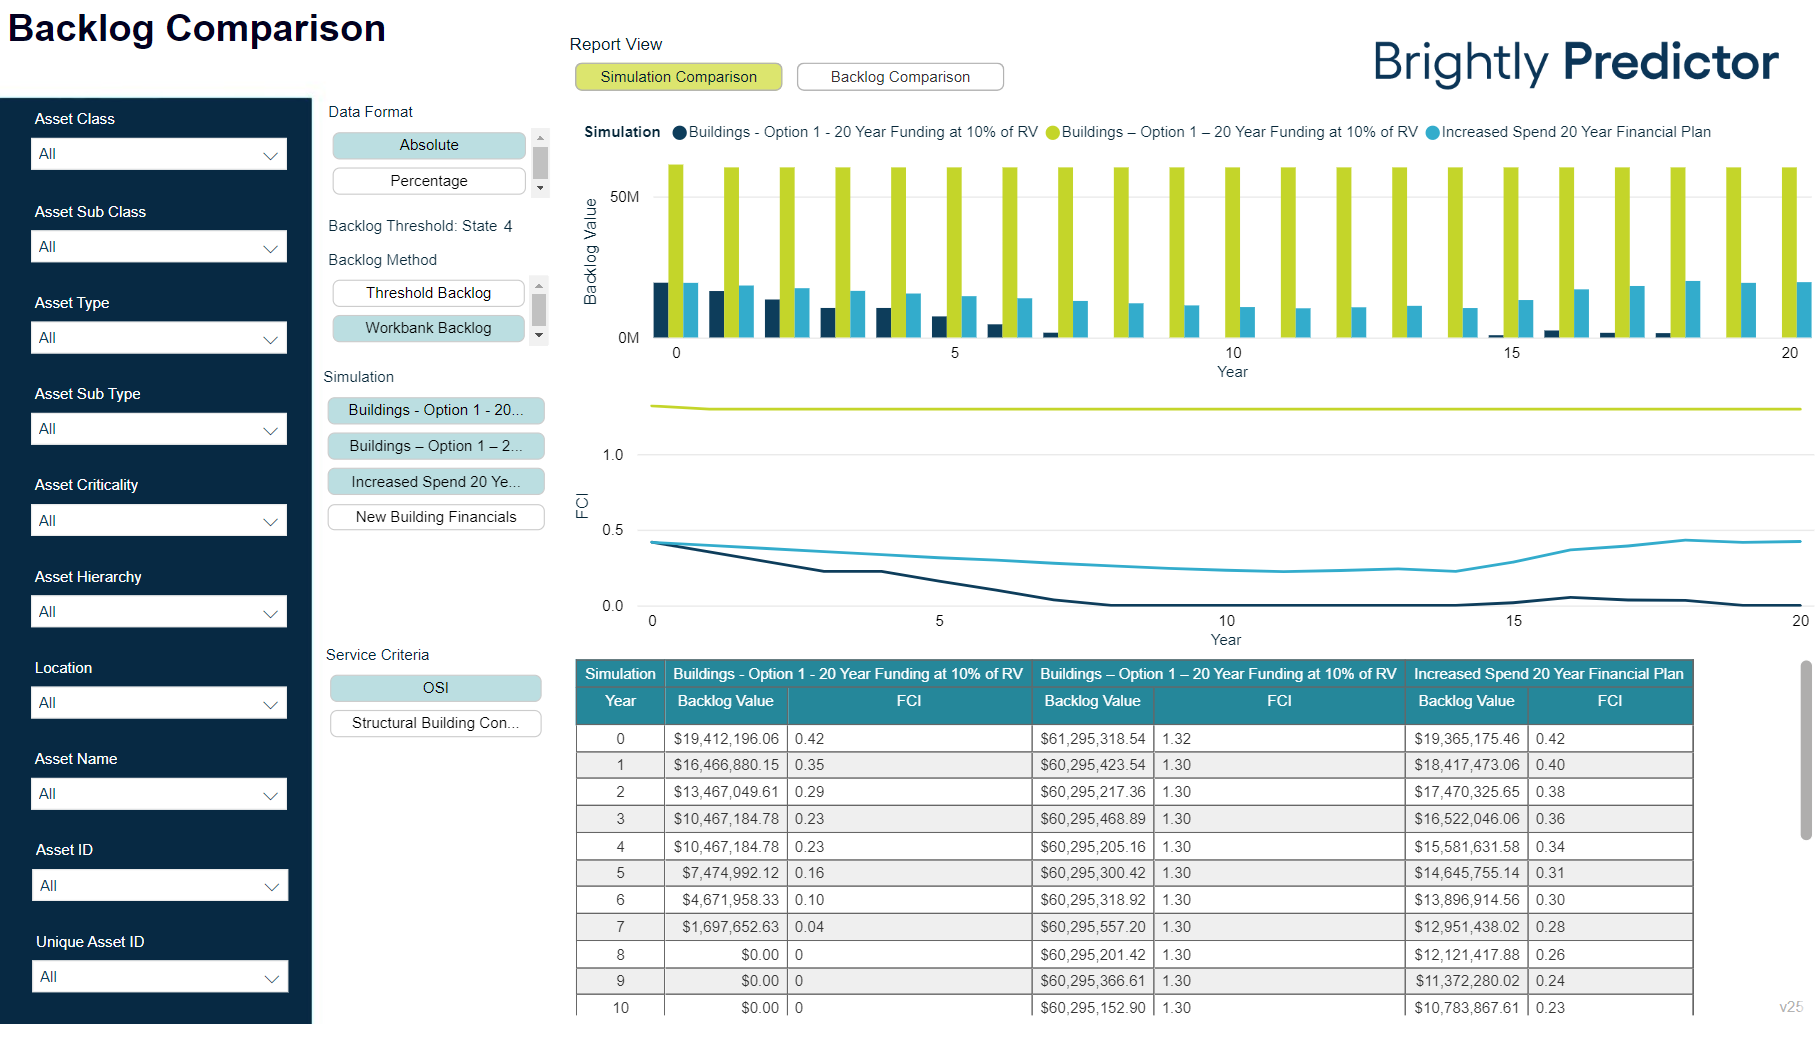
Users will now be able to switch between Simulation Comparison and Backlog Comparison report views.
Note: The FCI (Facility Condition Index) graph will only be enabled if users have provided the Asset Value optional mapping during the import process. It would also be advisable to provide the Location optional mapping for filtering and reporting purposes.
